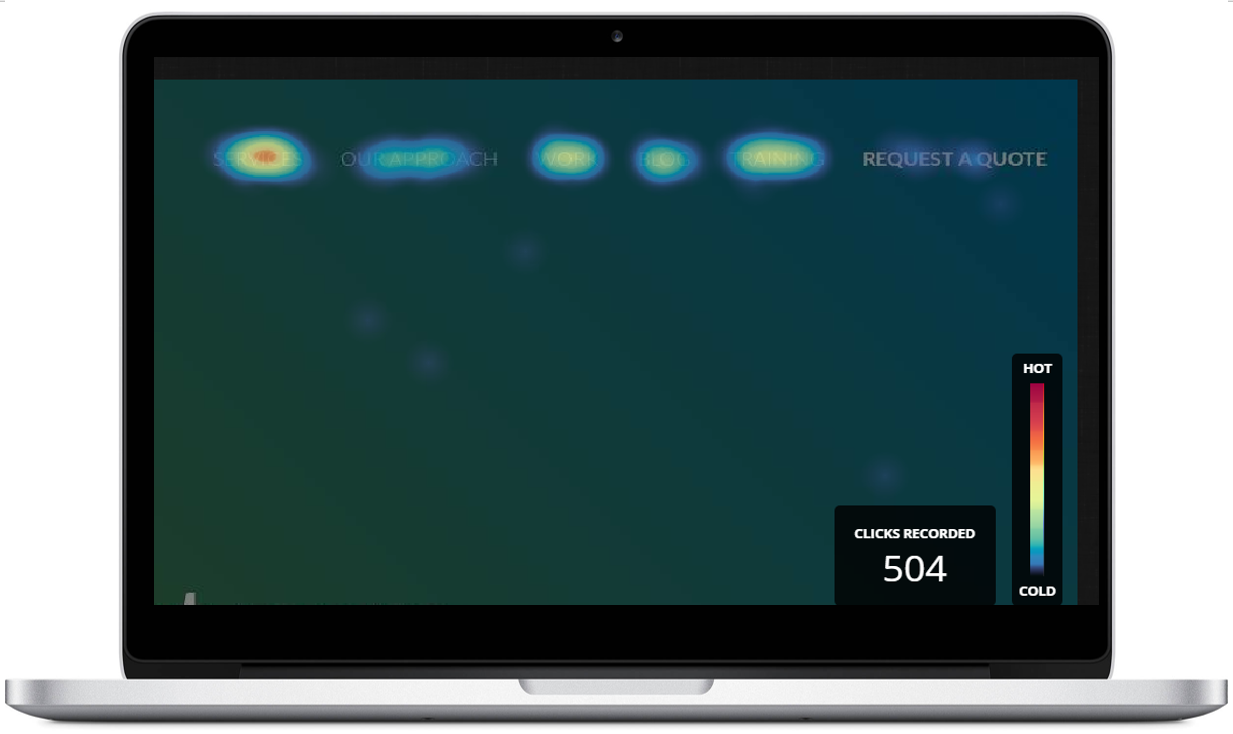
Have you ever wondered what exactly people are looking when they visit your website? Or perhaps where they are clicking? Or if they are scrolling all the way to the bottom of a web page? If you’ve wondered any of these things, you might want to spend some time looking at heat maps of your web pages.
So, what is a heat map? According to Optimizely, a heat map is “a graphical representation of data that uses a system of color-coding to represent different values. Heat maps can be used to show where users have clicked on a page, how far they have scrolled down a page, or used to display the results of eye-tracking tests.”
Here at MINDSCAPE, one of our favorite heat mapping tools is Hotjar. We use it when we are planning content, redesigning web pages, and evaluating the performance of both new and existing pages.
We recently added a new top level page to the website of one of our clients. In a planning session, we were evaluating the performance of the page and trying to decide if there were any adjustments that needed to be made to the content and design, so we took a look at the Hotjar heat maps.
Based on the heat maps we were able to gain some interesting insights:
- At the top of the page, there was an image with some copy on it. Many people tried to click on the header image, based on this behavior we decided to include a button in the header image.
- Site visitors were spending a lot of time looking at the contact form at the bottom of the page, and while some were completing it, there were not as many form fills as we would like. So we decided to make some adjustments to the form.
- We learned that a majority of the visits to the page, 86% to be exact, were coming from mobile devices. While the page was optimized for mobile, we wondered if there were more adjustments that could be made so the page would be EVEN MORE mobile friendly.
- The page talks about a variety of the products and services that our client offers, by taking a look at the clicks and mouse movement trackers, we were able to make assumptions about the things that site visitors are most interested in, so we can more content about those topics in the future.
Heat maps are just one of the many tools out there that can help you evaluate the performance of your website.


