


If you are active in Google Analytics, you have probably noticed the latest update made to the “homepage.” The new update automatically brings useful and relevant data to the front page of a Google Analytics account, making it easier for users to locate important information in a timely fashion. I talked to one of Mindscape’s strategists, Han Lee, to see what he had to say about the update. Take a look!
What is the primary change that has been made?
The primary design change is that users are now shown a dashboard on the “home screen”. Users have always been able to customize their own dashboards, but these things are not always easy to set up for those new to Web Analytics and/or GA. Now, users do not have to take the time to customize their own dashboard. Instead, when users log in, they will see a preset dashboard that is filled with important information any analyst would find useful.
What do you personally think of the change?
I think it is a convenient feature that will get users more engaged with the tool. Data is now easier to get to and more cleanly displayed. In addition, users now have easy pathways to more in depth information on all of the included dashboard sections. For example, the first “block” that a user sees is traffic data that indicates the change in traffic and engagement of the last seven days compared to the previous 7 days before that.
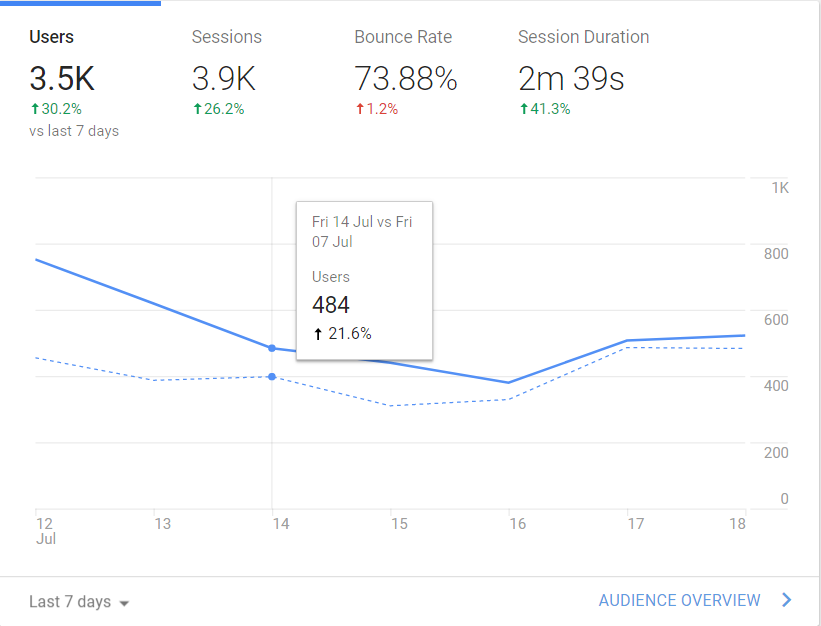
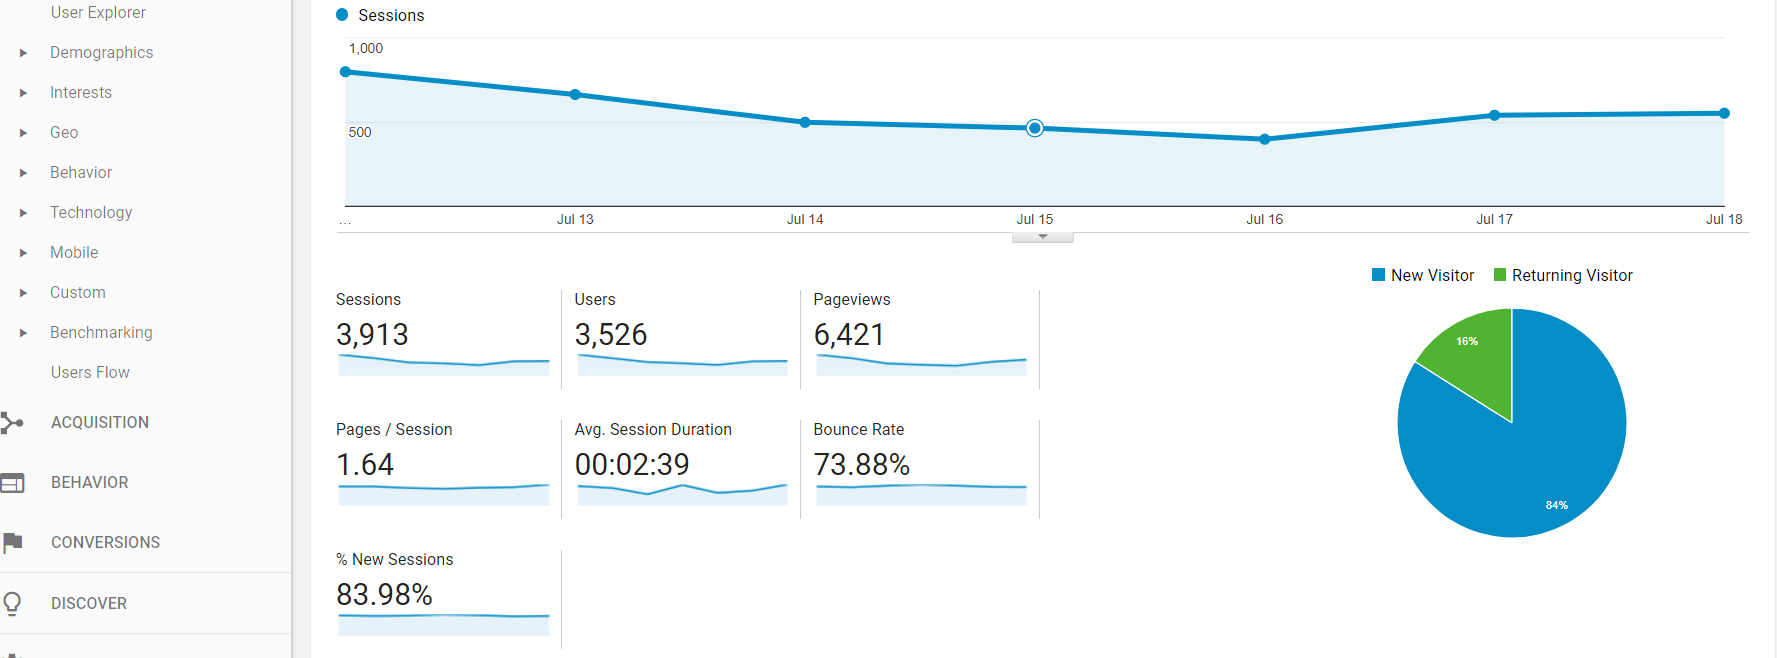
Users can toggle between different date ranges and click on the Audience Overview link to travel to a section where they can filter their search by things like demographic, geographic, and device data.
What do you like most about the update?
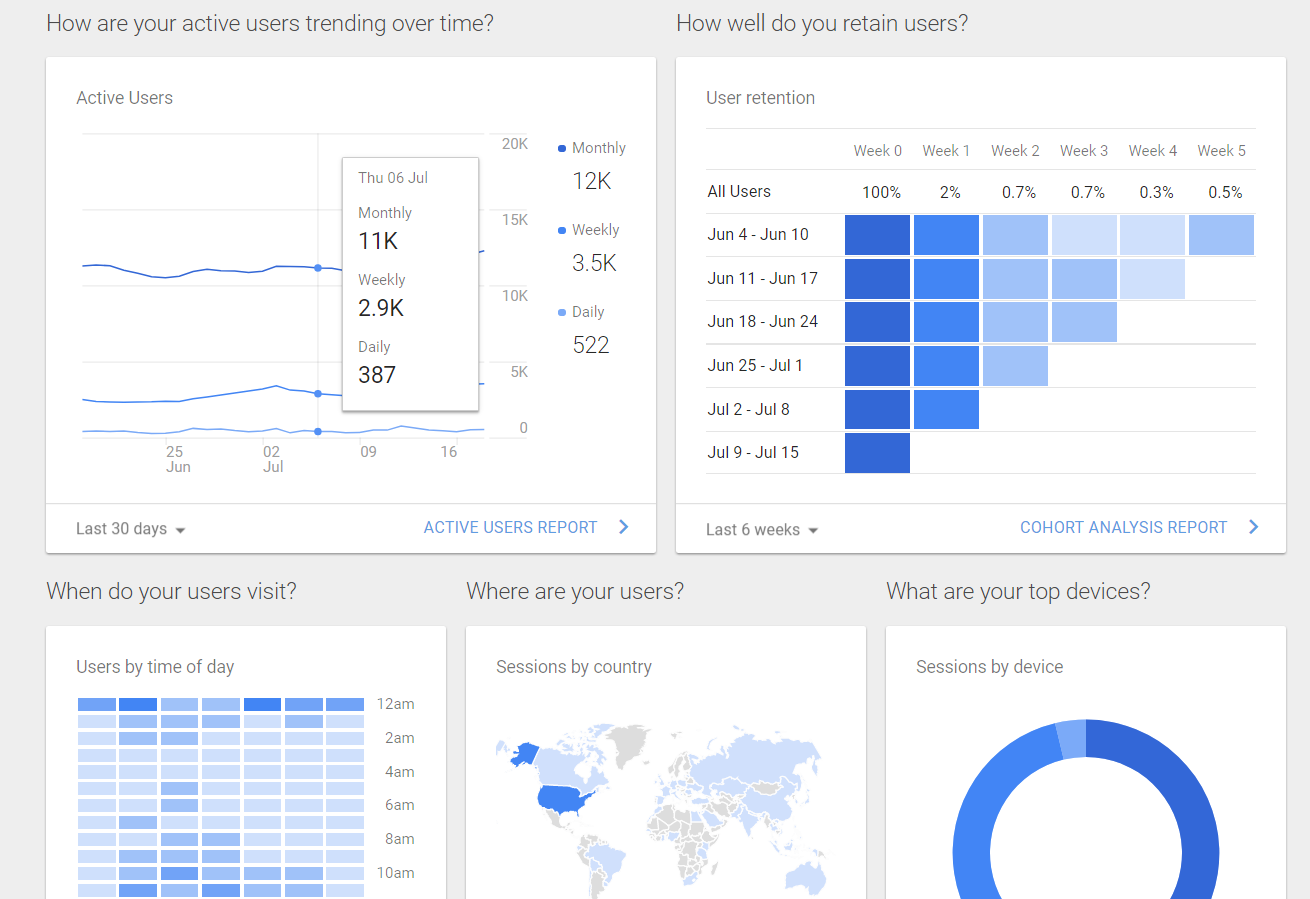
The feature I like the most is the second block on the dashboard. This block shows you when users visit your site. This information is incredibly helpful in understanding when to make changes or announcements to your website. It is not something that is always at the forefront of my mind, so seeing it on the “home screen” serves as a constant reminder to incorporate this information into our strategy. Previously to get to this information, I would have had to travel to 4 different sub-pages.
Do you have any advice for current users?
I have three pieces of advice for Googla Analytics users.
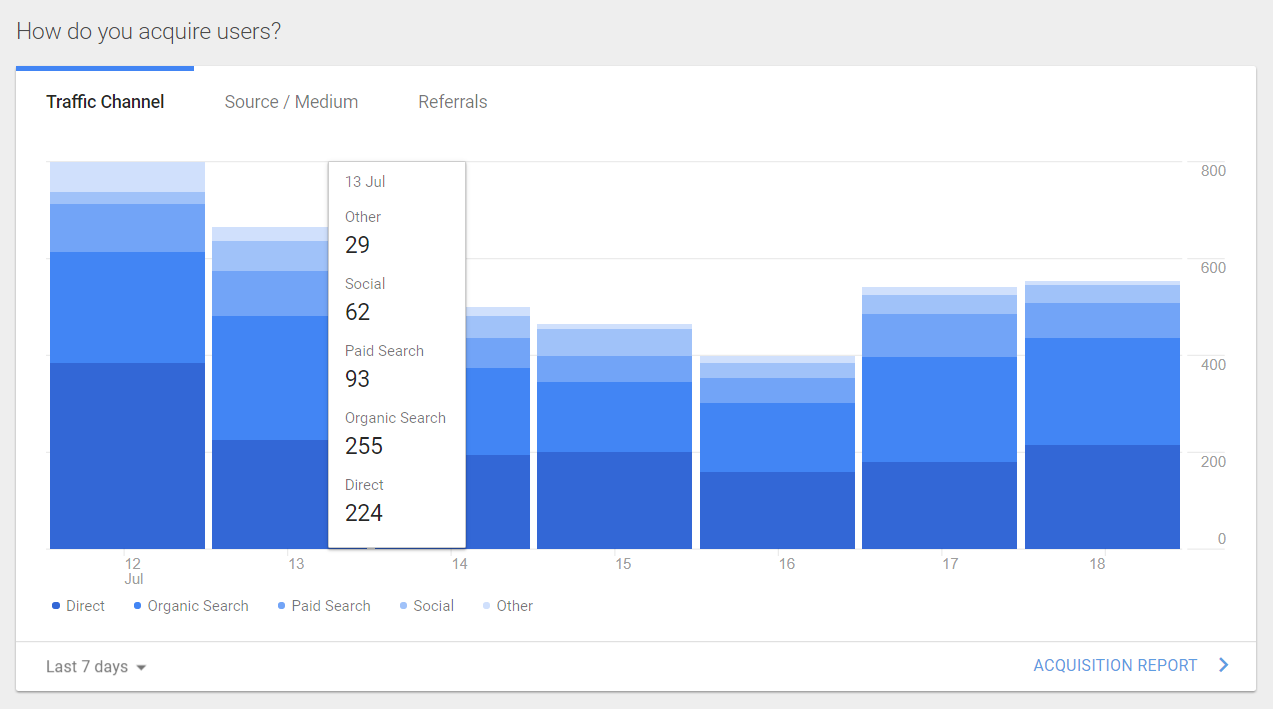
- Use this new information. The update visually displays things like how you acquire users, how well you retain users, where your users are, and when your users visit. Seeing all of this information on one screen can help you get an easy snapshot of how your site is performing.
- Take the information for what it is. It can be easy to jump to conclusions based on the high-level data given, but before jumping to any serious conclusions be sure to take a deeper dive into relevant sections of analytics.
- Customize your “home screen.” While the information provided by GA is fantastic, don’t be afraid to add sections that you find personally helpful.
How can you use analytics to improve your website’s performance?
Here at Mindscape, we help our clients interpret data so they can make informed, positive changes to their websites and digital strategies. If you want to increase visits, leads, and ultimately customers from your website, click below to contact us. We’ll give you some insight into what you can do to start improving your website’s performance right now.
